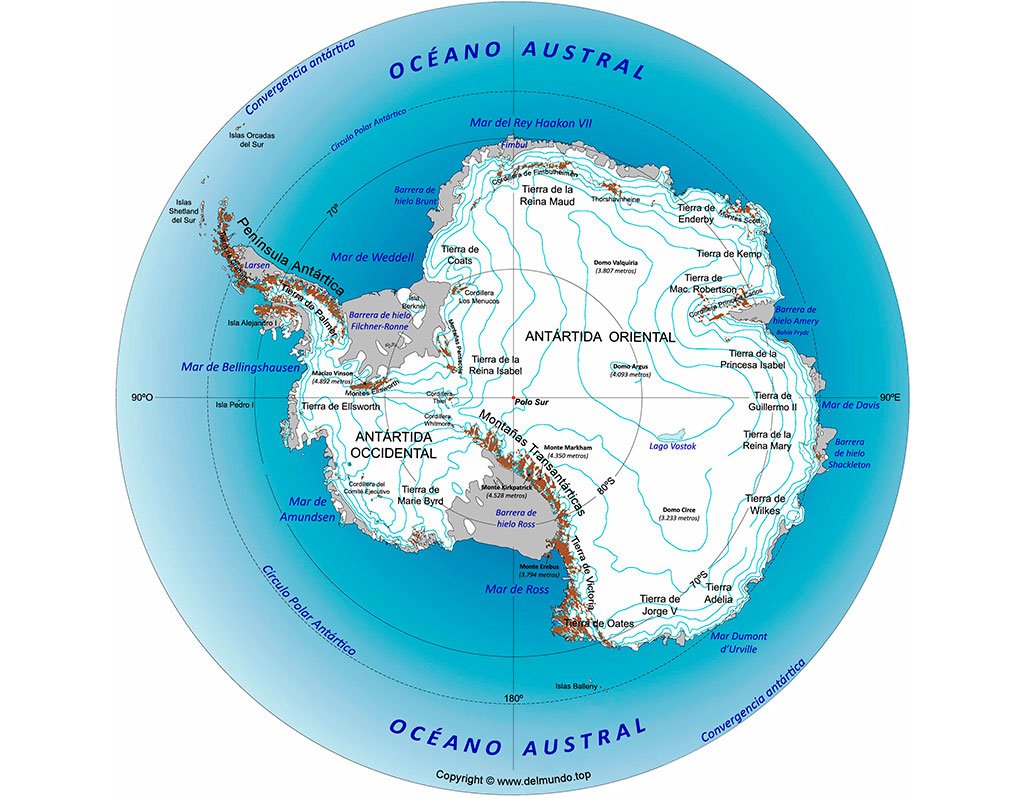
Mapping Antarctica was once a challenge for cartographers, but new technologies now enable more accurate and realistic maps of Antarctica
Antarctica has long been an enigma for scientists and explorers. While much of the world has been thoroughly explored and documented, maps of Antarctica remained a mystery in many aspects. The introduction of the “Reference Elevation Model of Antarctica” (REMA) marks a significant step toward a more detailed understanding of this icy continent.
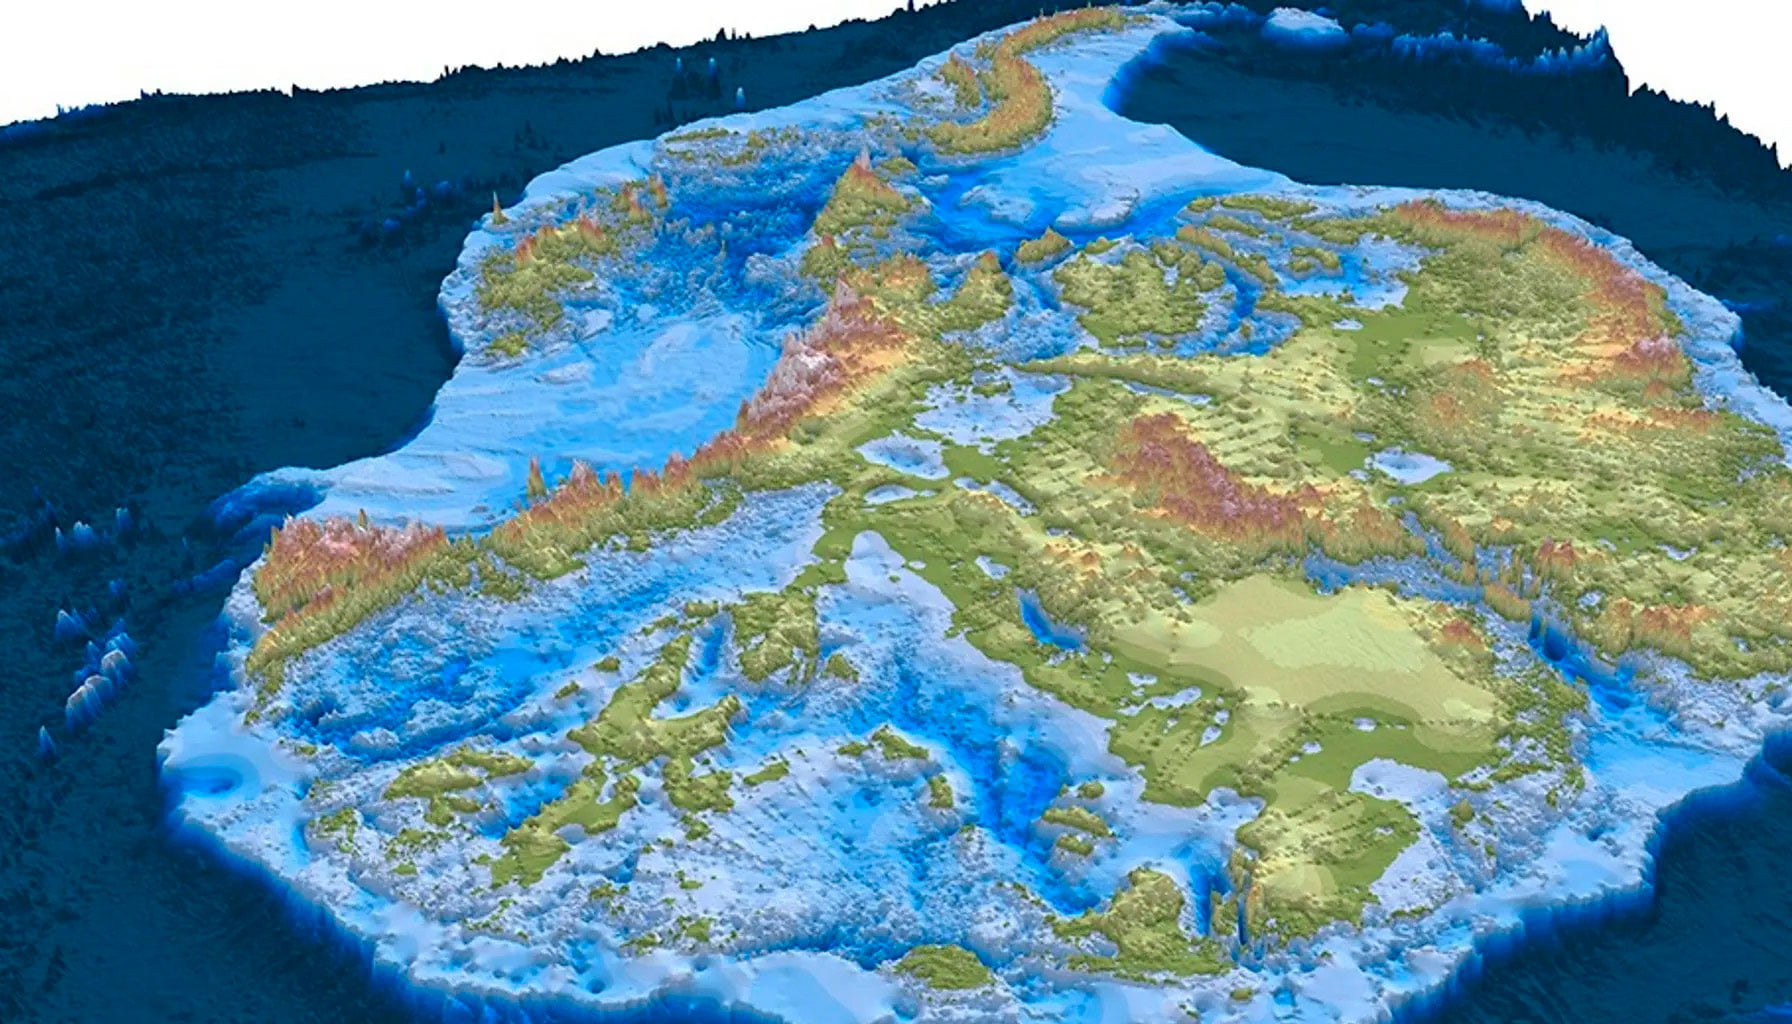
REMA is a groundbreaking tool that has provided researchers with an unprecedented view of every fold of Antarctica, using high-resolution satellite images collected over six years to create comprehensive maps of Antarctica. Despite recent advancements in exploration technology, creating accurate maps of Antarctica has been challenging due to the continent’s harsh climate and vast size.
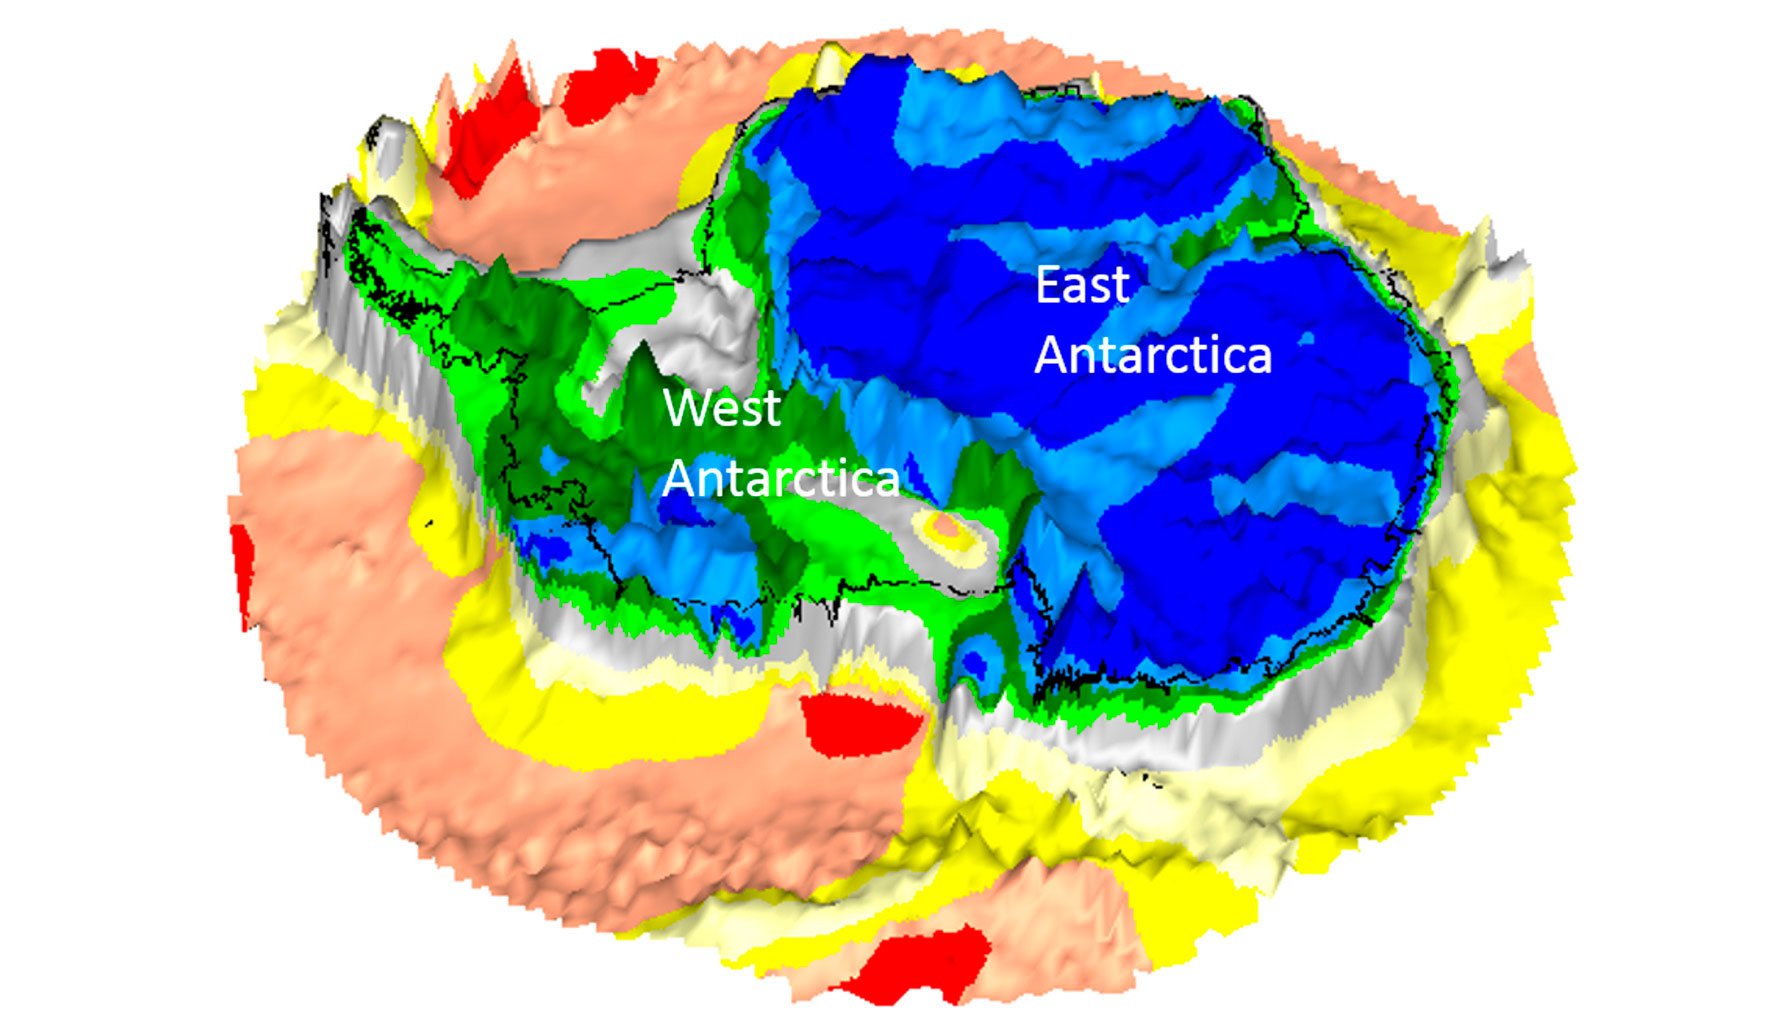
Before the development of REMA, our maps of Antarctica were less detailed than those of other regions, sometimes even less detailed than maps of Mars. This limited precision hindered detailed and accurate studies. Now, with REMA, details can be observed with a resolution of up to two meters, representing a significant advancement in Antarctic cartography and greatly improving our maps of Antarctica.
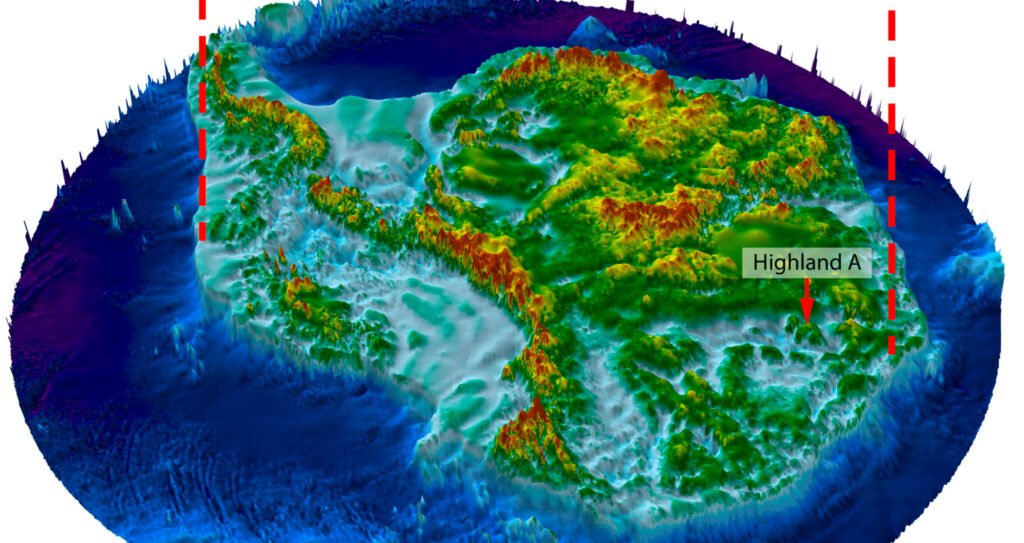
The Reference Elevation Model of Antarctica is not just a traditional map; it provides a detailed three-dimensional representation of the Antarctic terrain. The model combines hundreds of thousands of satellite images to deliver a comprehensive view of the continent’s elevations, river channels, and the density of glacial layers.
This precision is crucial for better understanding the changes occurring on the continent, especially in the context of accelerated climate change, making REMA an essential tool for creating accurate maps of Antarctica. Antarctica, covered 99% by ice, serves as a critical indicator of global climate changes.
The continent’s ice shelves are breaking off, and glaciers are losing mass, contributing to rising sea levels. Accurate maps of Antarctica are essential for tracking and predicting these changes and their global impact. These developments highlight the importance of continually updating and improving our maps of Antarctica to ensure they accurately reflect the rapidly changing environment of this remote region.
Mapping Antarctica from 2D to 3D
Thanks to REMA, scientists can now monitor changes in Antarctica with greater precision, updating the maps of Antarctica as the months progress. This capability not only aids research but is also vital for the safety of expeditions and operations on the continent. Although REMA is primarily a scientific tool, it has broader applications as well. The detailed maps of Antarctica created by REMA can be explored from home, allowing anyone to see the continent in stunning detail. Additionally, the team behind REMA has crafted a classic map for those interested in a more aesthetic perspective of the region. This project exemplifies how modern technology can make advanced geographic information accessible to the general public, enhancing both scientific and public understanding of Antarctica.
Besides REMA, the Mapping and Geographic Information Centre (MAGIC) of the British Antarctic Survey has developed the Antarctic Digital Database (ADD). This comprehensive resource includes detailed topographic information, such as coastlines and contours, and is regularly updated to reflect changes in ice shelves and other phenomena. The ADD serves as an essential tool for scientific research and safety, providing accurate and up-to-date maps of Antarctica that are crucial for understanding the continent’s dynamic environment.
The latest update to the ADD has incorporated data on recent changes in the ice shelves, such as the calving of icebergs and the expansion of certain ice areas. Additionally, new islands and rock formations have been discovered and included in the maps of Antarctica, demonstrating the importance of satellite technology in modern cartography. These updates not only enhance our understanding of Antarctic geography but also highlight the need to continually monitor this changing environment. Accurate maps of Antarctica are essential for tracking and predicting environmental changes, ensuring that researchers and policymakers have the information they need to address the challenges facing this unique region.
Open Access and International Collaboration in Creating Maps of Antarctica
The Antarctic Digital Database (ADD) is accessible through an online map viewer, allowing both researchers and the public to explore detailed maps of Antarctica in medium to high resolution. This open access to the maps of Antarctica facilitates international collaboration and data exchange, which are crucial for advancing our understanding of the continent and its dynamic environment. The ADD provides a valuable platform for sharing detailed geographic information, enhancing both scientific research and public awareness of the unique features and ongoing changes in Antarctica.
In summary, advancements in Antarctic cartography, particularly through the Reference Elevation Model of Antarctica (REMA) and the Antarctic Digital Database (ADD), have significantly transformed our understanding of this remote continent. These high-resolution maps of Antarctica are essential not only for scientific research but also for fostering a deeper connection with the continent. They enable exploration and learning about one of the most inhospitable and fascinating places on Earth, offering insights into its complex and changing landscape.
Melting ice is rapidly transforming polar landscapes, compelling scientists to continually update and redraw maps of the Arctic and Antarctic. The British Antarctic Survey (BAS), a world-renowned scientific institution, has recently presented new profiles of these polar regions. These updated maps of Antarctica and the Arctic highlight the profound effects of climate change and, to a lesser extent, the construction of infrastructure such as ports and cities. The updated maps provide critical data that reflect the ongoing environmental changes in these sensitive regions.
BAS’s polar maps have become a global reference for scientific studies and maritime navigation. In their latest update, presented on June 8, significant alterations in the coastlines, islands, and ice masses were documented, evidencing the impact of melting ice. These changes include entirely new data on the extent of sea ice, as well as updated information on cities and airports in the Arctic. These comprehensive updates to the maps of Antarctica and the Arctic are vital for understanding the broader implications of these environmental changes, providing essential information for researchers and policymakers worldwide.
Melting Ice Forces Redrawing of Arctic and Antarctic Maps
Melting ice is rapidly transforming polar landscapes, forcing scientists to redraw maps of the Arctic and Antarctic. The British Antarctic Survey (BAS), a world-renowned scientific institution, has recently presented new profiles of these polar regions. These updated maps highlight the effects of climate change and, to a lesser extent, the construction of infrastructure such as ports and cities.
The new Arctic map covers all land and ocean areas north of 60° N. Every detail has been updated or verified to reflect the current situation. For instance, many Canadian Arctic cities now appear with their indigenous names, such as Sanirajak and Naujaat. Additionally, human infrastructure, including roads, railways, and airports, has been updated, improving connectivity to the most remote areas.
Among the most notable physical changes in this update are new ice fronts, reflecting the retreat of major glaciers in Greenland and Svalbard. The maps also show changes in the extent of lakes, which are adapting to the constantly changing surrounding landscapes. These details are crucial for understanding the transformations in the Arctic ecosystem.
The maps include thematic inserts that highlight relevant and current aspects of the region. In the Arctic, permafrost and land cover are highlighted, elements that are rapidly changing due to global warming. Similarly, the maps of both poles show the extent of sea ice. BAS notes that these maps illustrate the average sea ice extent over the past 30 years, with a new 10-year average for comparison.
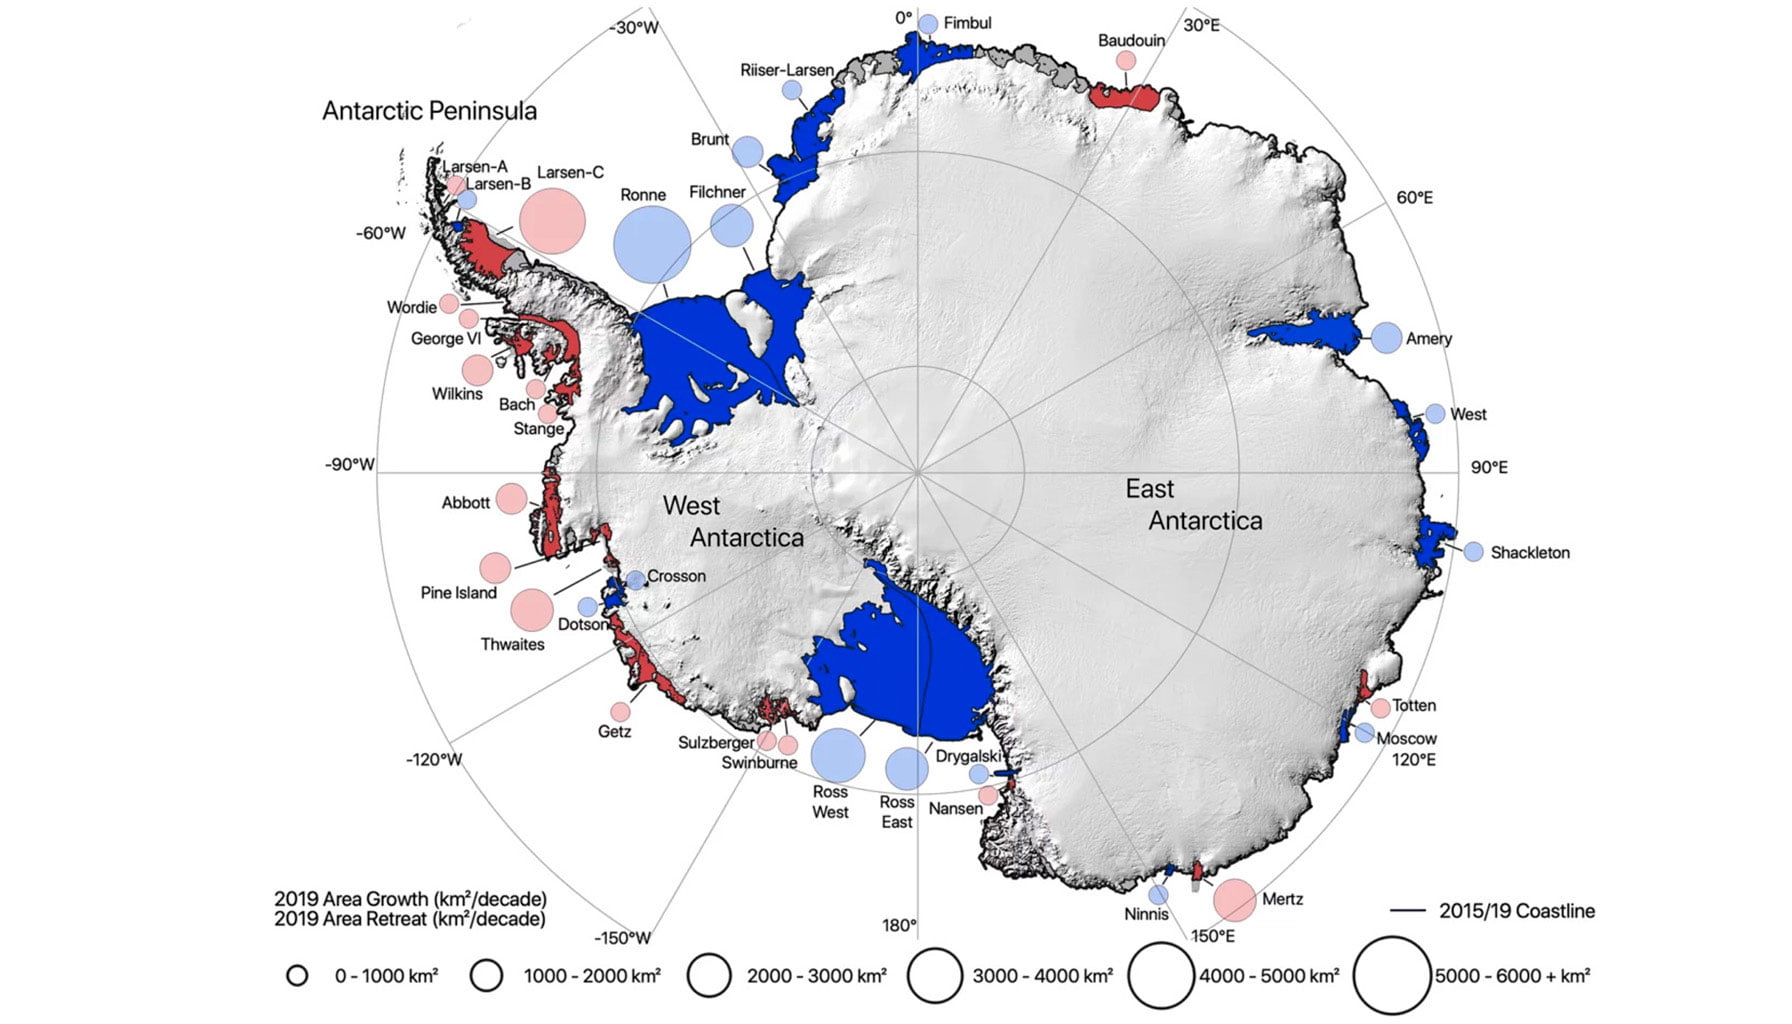
In Antarctica, the updates include new extensions of the ice shelf. The recent calving of iceberg A76 from the Ronne Ice Shelf in 2021 and iceberg A81 from the Brunt Ice Shelf in 2023 have brought many ice shelf fronts closer to the continent. These changes are essential for accurately representing the new Antarctic landscape.
The Importance of Updated Cartography for Accurate Maps of Antarctica
Elena Field, a cartographer at the British Antarctic Survey (BAS), emphasizes the importance of frequently updating the maps of Antarctica. The polar regions are undergoing rapid changes due to the effects of climate change and infrastructure development. Additionally, current satellite data provide a more detailed panoramic view of the Antarctic continent, enhancing our understanding of these remote landscapes. Regular updates to the maps of Antarctica ensure that the most accurate and up-to-date information is available, which is crucial for scientific research and environmental monitoring.
The new maps of Antarctica also feature improvements in contouring and hill shading, as well as in bathymetry. The contours and shading are derived from the REMAv2 dataset provided by the Polar Geospatial Center, offering unprecedented detail for all of Antarctica. Bathymetric data, which map the seafloor, come from a new version of the “General Bathymetric Chart of the Oceans,” updated with data collected during various scientific cruises. These enhancements in the maps of Antarctica provide a more comprehensive understanding of the continent’s topography and underwater features, essential for both navigation and scientific exploration.
Mapping Antarctica has seen significant advancements thanks to various methodologies that allow for a deeper understanding of the frozen continent. These methods are essential for studying the impact of climate change, geography, and the area’s ecology. A key focus is on mapping the ice shelves, which are critical for understanding the dynamics of Antarctica’s ice cover. This type of mapping involves identifying and monitoring the large floating ice masses surrounding the continent, and the latest maps of Antarctica have incorporated advanced techniques for this purpose.
Scientists use high-resolution satellite images and synthetic aperture radar to measure the extent and thickness of these ice shelves. Recent examples include tracking icebergs like A76 and A81, which have broken off from the Ronne and Brunt Ice Shelves, respectively. These detailed maps of Antarctica are crucial for understanding the calving events and their impact on ocean currents and rising sea levels, which are critical aspects of climate change studies. Accurate mapping of these events provides essential data for predicting future changes and their potential global implications.
High-Resolution Maps of Antarctica with Up to 2-Meter Detail
Another crucial aspect of Antarctic mapping is topographic mapping, such as that provided by the Reference Elevation Model of Antarctica (REMA). This three-dimensional terrain model has been created from a vast collection of satellite imagery, allowing for a resolution of up to two meters.
This level of detail enables researchers to study the altitudes and geographical features of Antarctica, including mountains, glaciers, and other formations. This type of mapping is vital not only for geophysical and climate research but also for the planning of expeditions and the installation of research stations. It provides a detailed foundation for understanding the structure and dynamics of the ice, as well as the flow of glaciers, which are important indicators of climate change.
Bathymetry, or the mapping of the seafloor, is another essential component. This mapping is conducted using sonar and satellite data to measure the depth and characteristics of the seafloor. The information obtained from these studies is incorporated into the “General Bathymetric Chart of the Oceans.” This type of mapping is fundamental for safe navigation in Antarctic waters and is crucial for oceanographic studies.
Moreover, it provides key information on how seafloor features interact with ocean currents and ice shelves, which is essential for modeling these systems and better understanding the Antarctic marine ecosystem. The mapping of sea ice extent focuses on tracking changes in ice coverage in the seas surrounding Antarctica.
New Technologies Enable a Realistic Image
Using satellite data and climate models, scientists can monitor the extent and thickness of sea ice, comparing long-term averages with recent data. This ongoing analysis is crucial for identifying trends and predicting future changes in ice coverage, which has significant implications for biodiversity, global climate, and regional navigation. The maps of Antarctica produced through these methods provide critical insights into the dynamics of sea ice, helping researchers understand current conditions and anticipate future changes due to global warming.
These maps of Antarctica not only help to understand the present state of sea ice but also allow for predictions about how these areas may evolve in response to global warming. The various mapping techniques used in Antarctica, such as those focusing on ice shelves and sea ice extent, are complementary and offer a comprehensive view of this critical continent. While the mapping of ice shelves and sea ice extent addresses climate-related changes, topographic and bathymetric mapping provide essential details about the continent’s geography and underwater features. Together, these detailed maps of Antarctica are indispensable for scientific research, planning operations on the continent, and understanding the natural processes affecting Antarctica and, consequently, the entire planet.
Older maps of Antarctica offered limited and less detailed information, primarily due to the technological limitations of the time. These early maps lacked accuracy in representing altitudes, geographical features, and the extents of ice cover. In contrast, the new maps of Antarctica utilize advanced technologies such as high-resolution satellite images and digital elevation models. This allows for precise three-dimensional representations of the terrain, including detailed depictions of ice shelves, bathymetry, and changes in sea ice extent. These modern maps thus provide a much more accurate and useful tool for scientific research and navigation, greatly enhancing our understanding of the continent. However, some mysteries from the old maps of Antarctica still remain, highlighting the ongoing need for exploration and study.
What Appears on the Piri Reis Map?
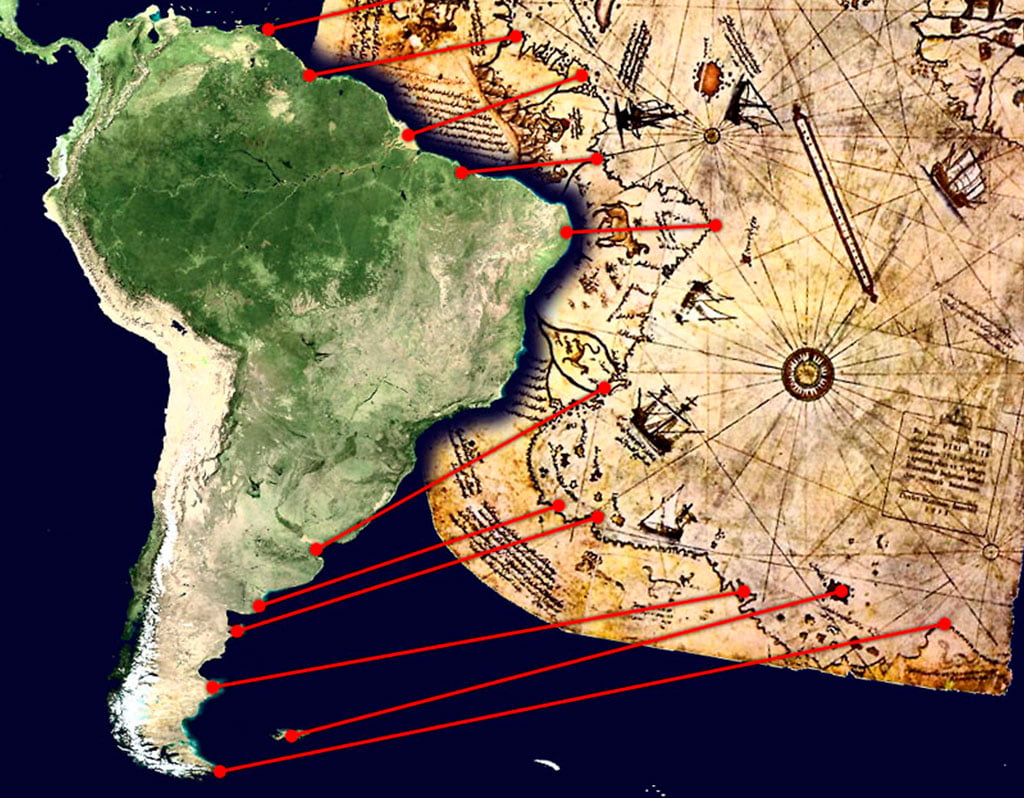
Maps of Antarctica have been a source of fascination and controversy over the years, particularly with the discovery of the enigmatic Piri Reis map in 1929. Created in 1513 by the Ottoman cartographer Piri Reis, this map has sparked intense debates due to its depiction of what appear to be the coasts of America and Antarctica, long before these lands were officially explored by Europeans. The mysterious accuracy of these representations has led to various theories about ancient knowledge and cartography, making the maps of Antarctica a topic of enduring intrigue.
The discovery of these maps occurred on October 9, 1929, when theologian Gustav Adolf Deissman, while cataloging documents in the library of Topkapi Palace in Istanbul, uncovered two fragments of the map. What was surprising was that these fragments showed large stretches of coast along the west of Africa and the Iberian Peninsula, seemingly representing America and Antarctica. At that time, these territories were largely unknown to most Europeans. The official discovery of Antarctica did not occur until 1821, which raises the mystery of how Piri Reis could have depicted outlines so similar to those of more recent maps of Antarctica.
Piri Reis, whose full name was Ahmed Muhiddin Piri, was an Ottoman navigator and cartographer who lived between 1465 and 1553. According to his own writings, he created his maps of Antarctica based on a lost map obtained from a Castilian prisoner who had accompanied Christopher Columbus on his voyages. Piri Reis claimed that his maps were supplemented with information from “the ancient kings of the sea.” He finished the map in 1513 and presented it to Sultan Suleiman the Magnificent in 1517, receiving a promotion to admiral as a reward. This story adds another layer of mystery to the Piri Reis map, as it suggests that the maps of Antarctica may have been informed by older, possibly lost sources of geographic knowledge.
Maps of Antarctica Inspired by Fishermen’s Tales?
The first fragment of the Piri Reis map shows what appears to be the eastern coast of South America, an island presumed to be Hispaniola, and part of the Antarctic coast. The second fragment, even more puzzling, seems to depict parts of North America, a territory that, in theory, had not yet been mapped.
Piri Reis’s maps of Antarctica also include drawings of animals that could not inhabit Antarctica, such as a moose, which has led to theories about possible lost geographical knowledge. Some suggest that Piri Reis or his sources might have recovered this knowledge. However, the more widely accepted interpretation is that these maps do not accurately reflect the coasts of America and Antarctica but are based on vague ideas and speculations of the time about what existed beyond the Atlantic.
The inaccuracies in the maps of Antarctica are evident, with South America and Antarctica depicted as connected continents, although they are actually separated by the Drake Passage. Additionally, in the representation of South America, there are depictions of fantastical creatures and mythological figures, such as the Blemmyes, men without heads with faces on their torsos, according to Roman mythology.
These elements suggest that the coasts depicted in Piri Reis’s maps are more a representation of a terra incognita, an unknown territory believed to exist but not yet explored. In ancient maps, such areas were often marked with fantastical creatures or the phrase “hic sunt dracones” (here be dragons), symbolizing dangers and the unknown.
In conclusion, Piri Reis’s maps of Antarctica are fascinating historical artifacts that reflect both the knowledge and assumptions of their time. Although they do not provide an accurate representation of America or Antarctica, they offer an intriguing glimpse into how ancient cartographers perceived the world beyond the known limits. These maps continue to be a subject of study and speculation, not only for their content but also for the questions they raise about the geographical knowledge of ancient civilizations. This remains one of the great mysteries of Antarctica.
